

click below to login to your secure account
By Scott McIntyre
Co-Head of Investment Management
HilltopSecurities Asset Management
The dominant economic story of the third quarter was an alarming rise in bond yields all along the curve. Although a sharp upward move in crude oil prices and the corresponding rise in inflation expectations were an obvious driver, there were a number of contributing factors, most of which are considerably less transitory than the cost of energy. Among these are improved domestic growth and labor conditions, a surge in corporate borrowing, a sobering national debt milestone, a shift in monetary policy, and a new Fed Chair whose lack of forward guidance and muddled messaging has contributed to a mounting loss of market confidence.
Economic growth has picked up. The final revision to Q2 GDP pushed headline growth upward from +1.5% to +2.2%, but importantly, the so-called final sales to private domestic purchasers, which considers only consumer spending and private fixed investment, grew at a strong +4.6% annualized rate. Third quarter data collection isn’t complete, but the Atlanta Fed’s Q3 GDPNow measure was tracking at +3.7% on the last day of September. Improved economic growth is normally a positive, except when inflation has been persistently above the Fed’s target for over four years. In this case, higher demand signals increased price pressure.
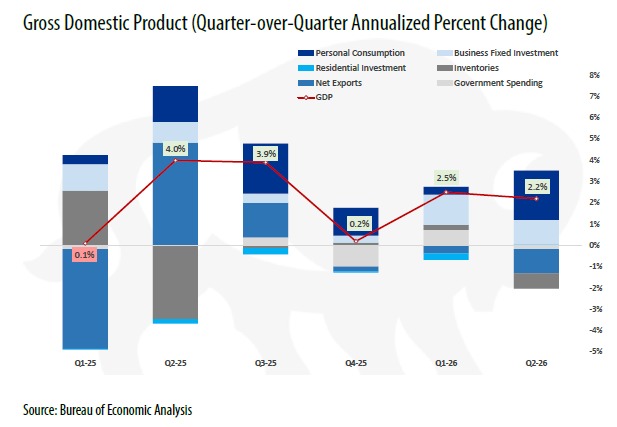
Looking forward, the two closely-watched purchasing managers surveys from the Institute for Supply Management (ISM) showed the factory and service sectors had both experienced solid expansion and rising price pressures in August, suggesting both trends should continue into the fourth quarter.
Non-farm payrolls (which have been wildly erratic over the past year) had slowed dramatically in June. The July payroll count was actually negative, while the previous month’s count was lowered further, dragging the three-month average down from a fairly healthy +111k to just +20k. But a month later, the August report abruptly rewrote the script with a +162k payroll increase, tripling forecasts, along with positive prior period revisions that pulled the 3-month average back up to +71k.
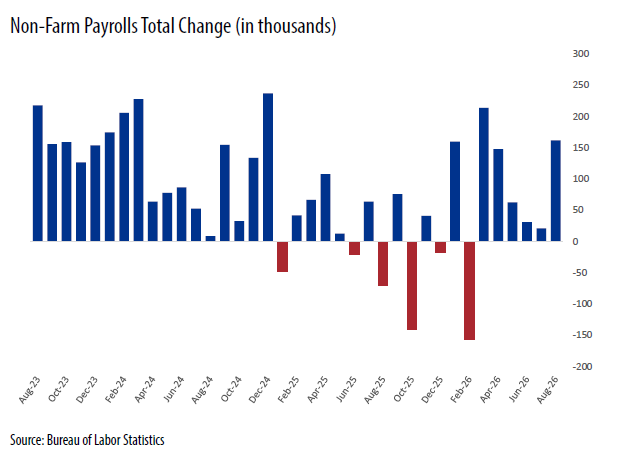
Two years ago, this increase would have appeared pitiful. However, breakeven job growth, representing the number of new jobs required to absorb increases in the labor force, has fallen dramatically since 2024 due mainly to a substantial drop in immigration and the ongoing retirement of baby boomers. As a result, the Federal Reserve and several regional Fed economists now argue that breakeven job growth may be near zero to modestly positive, depending on immigration assumptions.
There’s still no clear labor market trend, and the rapid expansion of AI further complicates the outlook, but the apparent rebound in August job creation signaled to Fed officials that their employment mandate was secure. This dubious assurance allowed policymakers to focus entirely on inflation.
Since February, the primary engine of headline inflation has been energy, with the daily price of crude oil driving inflation expectations and heavily influencing bond yields. President Trump’s announcement of a “memorandum of understanding” with Iran in mid-June had pushed crude futures sharply lower, but during the third quarter renewed hostilities reversed the trend with West Texas Intermediate (WTI) trading above $100 per barrel for the first time since 2022.
According to AAA, it was a record-setting September at the pump with the monthly average for regular unleaded at $4.33, 50 cents higher than the previous September record of $3.83 set in 2023. Although prices reached a cycle high of $4.48 in September, the all-time high for regular unleaded gasoline was $5.01, set in June 2022.
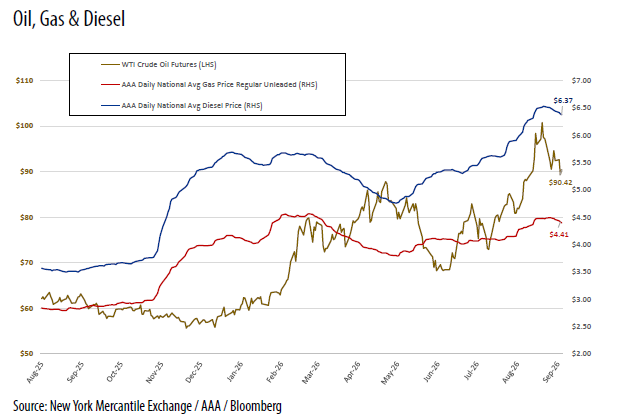
The diesel story was much worse, with limited refinery capacity contributing to a series of new highs before reaching a peak of $6.52 on September 22, up more than 70% in less than seven months. The problem with diesel is that severe price increases feed into just about everything harvested or transported. This suggests that headline inflation would likely seep into core prices, and if diesel remains extremely elevated, businesses would be forced to plan for higher future costs which increases the risk of inflation becoming embedded.
Diesel is about 25% of motor-fuel demand in the U.S., while gasoline is about 75%, according to the U.S. Energy Information Administration. However, global use is much higher. Europe relies heavily on diesel trucks as well as diesel passenger cars, China uses large volumes of diesel for freight, while emerging markets depend extensively on diesel-powered transportation and machinery. As a result, about 55% of global fuel use is diesel. The higher relative demand will likely push global goods prices higher, further increasing the cost of goods imported into the U.S.
Inflation is clearly a problem, but the degree of concern depends on the measure. The most familiar indicator is still the Consumer Price Index (CPI). Headline CPI was actually negative in June (-0.4%) and rose just +0.1% in July, following the direction of crude oil.
Energy prices heated up again in August pushing overall CPI up +0.4% and +3.4% year-over-year. Shelter costs also jumped, climbing +0.3% after a tiny +0.1% gain in July. The bright spot (for the time being) was that underlying inflation continued to ease with core CPI slowing to a +2.4% annual rate, the lowest since the spring of 2021.
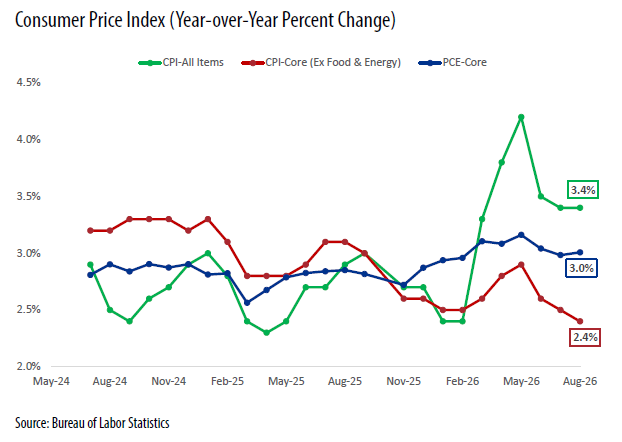
The Fed’s preferred inflation measure, Personal Consumption Expenditures (PCE), uncharacteristically above CPI all year, was unexpectedly friendly in August. Core PCE increased by just +0.2%, while July’s increase was lowered to +0.1%. On a year-over-year basis, the core rate was +3.0%, well below the +3.3% median forecast. Perhaps more importantly, the 3-month annualized core PCE pace was just +1.6%.
Stepping back from the headline CPI and PCE numbers, a number of alternate inflation gauges continue to signal disinflation rather than renewed acceleration. The Dallas Fed’s “trimmed mean PCE,” which excludes the most extreme monthly price moves and is considered one of the better trend inflation gauges, was at +2.2% year-over-year in August, down from roughly +2.4% earlier this year. And the Cleveland Fed’s median and trimmed mean CPI measures are both near +2.6%.
“Truflation,” a real‑time, inflation tracker that uses independently-verified data prices from over 15 million sources is currently near +2.9%. Taken together, these indicators suggest the underlying inflation trend may be in the range of +2.5% to +3.0%.
That being said, rental prices, one of the biggest deflationary components for years, seem to be normalizing. The Zillow Observed Rent Index (ZORI) showed U.S. rents at $1,962 in July, up +2.3% year-over-year, the fastest annual increase in more than a year. Zillow notes that the large wave of apartment construction that had restrained rents over the last two years is fading, causing the rental market to gradually tighten. At the same time, high mortgage rates and affordability challenges are pushing some would-be buyers into the rental market, increasing rental demand.
All-in-all, the inflation outlook for the remainder of 2026 doesn’t look especially promising, but with the annual core CPI rate at a four-year low and core PCE surprising to the downside in August, policymakers will experience a little less urgency in October.
With shelter costs unexpectedly higher in the latest CPI report, housing data has gained importance. Existing home sales, which typically account for about 85% of a normal market, fell to an annualized 3.98 million unit rate in August, near the weakest sales pace of the past decade. Years of tepid sales have boosted the available inventory, bringing supply to a ten-year high of 4.9 months.
New home sales rose to an annualized 684k unit rate in August but were significantly below the 800k pace from the previous year. Disappointing sales pushed the available new home inventory up to 483k, equivalent to 8.5 months of supply.
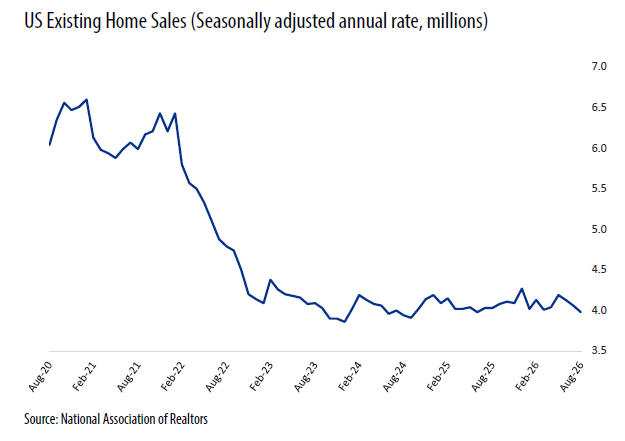
Average home prices may not be rising at the rapid Covid-era pace, but they’re generally not falling either. While builder discounts, incentives and reduced square footage have driven the average price for a new home down -5.8% year-over-year in August to $393,700, the median existing home price was up +1.6% to $429,100.
Available inventory has improved and buyers are gaining some leverage, but sticky prices and elevated mortgage rates continue to hinder demand. The average 30-year fixed-rate mortgage, according to Freddie Mac, rose 64 basis points during the month of September, beginning the new quarter at a three-year high of 7.28%. For cash buyers, which accounted for 27% of existing home purchases in August, mortgage rates don’t matter, but for borrowers the traditional “American Dream” has become even harder to achieve. According to the most recent survey by the National Association of Realtors, first-time home buyers accounted for just 21% of purchases last year, the lowest in 45 years of NAR tracking, while the median first-time buyer is now 40-years old, also the highest on record.
The best hope for the housing market would be lower interest rates, but ironically, current high rates and elevated inventory should suppress further home price increases. The housing sector may not contribute much to GDP growth in the near-term, but moderating selling prices should ease pressure on the wonky “owner’s equivalent rent” CPI component, which would provide a counterweight to rising apartment rents.
Fed officials held rates steady at the July FOMC meeting, but a hawkish tone at the post-meeting press conference suggested the committee’s patience was waning. Investors grew more certain of a near-term increase in late-August when Warsh told an audience at the Jackson Hole Economic Symposium that “underlying (inflation) trends have not meaningfully improved” and he’d be “hard pressed to describe broad financial conditions as restrictive.”
Warsh also reiterated that the committee should avoid “telegraphing” its policy plans, believing less guidance would reduce the market’s inclination to front‑run Fed decisions. Warsh hopes a “quieter Fed” will increase credibility.
In mid-September, as widely expected, the FOMC announced the first rate increase in three years. The vote to raise the overnight funds target by 25 bps to a range of 3.75% to 4.00%, was unanimous.
The question going into the meeting wasn’t whether or not the Fed would increase the overnight target, but rather how the Fed would frame the hike. Was it a limited tightening that essentially undid some or all of the three preemptive 2025 rate cuts, or the beginning of a longer series of hikes?
The official statement, released at the conclusion of the meeting, was even briefer than the July statement, and Warsh’s post-meeting press conference offered little beyond worn talking points. He acknowledged, once again, that inflation was too high, but otherwise held to his promise of a quieter Fed. To punctuate the point, Warsh declined to add his rate forecast to the September dot plot.
The bottom line is that the recent rise in oil prices is a huge problem with global supply being extremely tight. The Fed, as well as other central banks around the world, have little choice but to increase borrowing costs to slow demand, a necessary but unpopular remedy.
The FOMC’s move sparked an immediate response from the president, who declared on social media that “Interest Rates in the United States should be 1%, or less…,” reopening the debate over Fed independence and assuring the next FOMC meeting, just days before the mid-term elections, will have significant political implications.
Higher interest rates may, or may not, lower inflation expectations in the coming months, but there will be an immediate effect on U.S. funding costs at a time when the nation’s deteriorating financial condition is back in the spotlight.
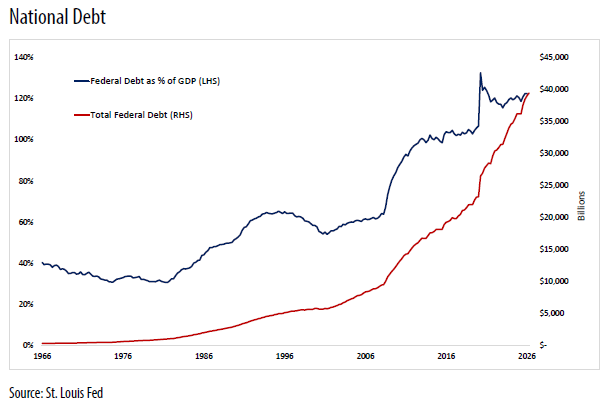
The national debt made headlines in late summer when it reached $40 trillion. Excessive borrowing has been an issue for decades, but the dramatic acceleration has amplified concerns. For perspective, it took nearly 200 years for America’s gross debt to reach $1 trillion for the first time in 1981. At that time, President Reagan told the nation in a televised address, “If we as a nation needed a warning, let that be it.”
Remarkably, it took only 12 years for gross federal debt to increase from $10 trillion to $20 trillion (2008-2017), and less than nine years to double from $20 trillion to $40 trillion. The latest baseline from the Congressional Budget Office (CBO) implies the U.S. gross debt will exceed $60 trillion before the end of 2036.
Maya MacGuineas, president of the Committee for a Responsible Federal Budget (CRFB) recently warned: “As the bond market warning lights are blinking red, our leaders in Washington seem to be asleep at the wheel. Washington needs a fiscal intervention.” The message from Ms. MacGuineas was bold, but all-too-familiar. It was just three years earlier that Fitch finally joined S&P and Moody’s in lowering the U.S. sovereign debt rating from AAA to AA. The downgrade itself wasn’t a concern, but at the time Fitch’s explanation grabbed the media’s attention. Fitch cited “alarm over the country’s deteriorating finances and expressed major doubts about the government’s ability to tackle the growing debt burden…”
From January 2009 through March 2022, the effective fed funds rate was just below 0.60%. When borrowing rates are near zero, it’s easy to ignore the national debt. But suddenly, interest rates are at their highest levels in decades, and the crippling cost of debt servicing is on center stage.
The U.S. government is now forced to spend over $1 trillion a year servicing its debt, and virtually all of the debt that’s rolling over is rolling over at higher rates. In January 2022, the U.S. paid an average rate of 1.56% on its outstanding Treasury obligations. By August 2023, the number had increased to 2.92% (Statista). By August 2026, the average rate had risen to 3.49% (U.S. Treasury Department). September promises to be even higher.
According to analysis from the CRFB: “Current yields are roughly one percentage point above where the Congressional Budget Office (CBO) projected they would be, which if sustained would add an additional $3.5 trillion to the debt over the next decade and boost deficits to a massive 8% of Gross Domestic Product (GDP) by 2036.”
The most current CBO baseline projects annual net interest costs will reach $2.1 trillion by 2036, but if borrowing costs stay close to where they are today, annual interest payments could nearly triple to $2.7 trillion by the end of the decade, according to CRFB projections.
As interest costs rise, debt accumulates more quickly, and the growing supply of debt can place additional upward pressure on interest rates. At some point, a cycle of rising debt and rising borrowing costs may force a painful adjustment in financial markets and government finances.
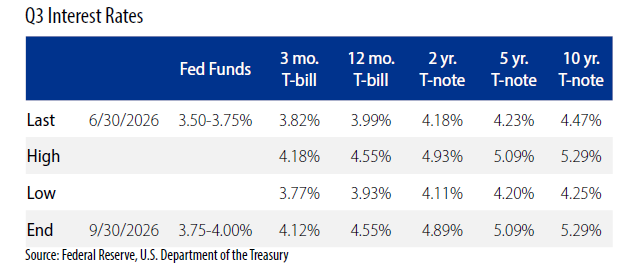
Bonds were absolutely clobbered in the third quarter. The two-year Treasury yield rose 71 basis points during the three-month period with 55 bps in September alone, while the 10-year Treasury climbed 82 bps with 54 bps coming in the final month. The 10-year closed the quarter at 5.29%, a 19-year high, while the 30-year bond reached 5.63%, the highest in 24 years.
If it’s any comfort, the market selloff isn’t confined to the U.S. with similar increases in government yields occurring in Germany, France, the U.K. and Japan.
Equities drew less than normal attention as the bond market story dominated the financial news. Both the S&P 500 and the Nasdaq indexes logged small gains for the quarter, while the Dow suffered a small loss, though all three reached fresh highs at some point during the three-month period.
The U.S. economy seems to be on increasingly solid footing, but that stronger demand (unfortunately) puts additional pressure on prices. Higher energy costs plus stronger growth (…throw in our national debt problem and competition for funding by hyperscalers) and higher rates could linger well into next year.
The outlook for GDP and employment depend so heavily on a favorable outcome for the investment and implementation of Artificial Intelligence that forecasts are of little value. The inflation path will depend largely on the situation in the Middle East. The fast approaching mid-terms could stoke urgency by the U.S. to negotiate an agreement, but lean global supply and limited refinery capacity suggest it may be years before energy prices return to prewar levels.
The Fed has begun what’s generally expected to be an abbreviated tightening cycle, but it’s unclear how much effect a series of rate hikes will have on overall demand. Cash-flush individuals and companies with strong balance sheets have limited borrowing needs and would be relatively unaffected. Hyperscalers are the exception but probably won’t alter borrowing plans as rates rise. Instead, the pain of higher interest rates is likely to disproportionately affect small businesses and the lower and middle class. With the Conference Board’s measure of consumer confidence ending the quarter at its lowest point since 2014, orchestrated demand destruction by the Fed won’t be well received.
The September dot plot showed Fed officials expect one more quarter point increase this year before holding steady for all of 2027. Committee members then expect gradual cuts beginning in 2028, eventually reaching a longer term neutral rate of 3.25%. Of course, the dot plot has been a woefully poor predictor, especially in the post-pandemic era …and the nation’s economists haven’t fared much better. The September Bloomberg survey mirrored the FOMC outlook with the median forecast among 66 economists indicating one more hike this year, unchanged policy in 2027 and a single rate cut in 2028.
But while economists and Fed officials forecast limited policy moves through 2027, the bond market is currently signaling between three and four quarter point increases with no indication of rate cuts on the horizon.
The higher-for-longer interest rate environment will impact the interest-sensitive housing and auto sectors first and will continue to chip away at consumer confidence and spending capacity until consumption drags GDP and job growth lower. The necessary but unpopular policy, almost certain to be heavily and publicly criticized, could strain Fed credibility and severely challenge Chairman Warsh’s plan to limit communication at a time when investors are desperate for guidance.
About Scott McIntyre, CFA
 As HilltopSecurities Asset Management’s Co-Head of Investment Management, Scott McIntyre specializes in investment management services and is responsible for the management, oversight and trade supervision of more than $30 billion in institutional fixed income assets for HilltopSecurities’ public sector municipal clients. Scott also provides investment advice and consulting, reviews local government investment policies, formulates overall investment strategies, evaluates account performance and oversees the day-to-day operations. He is a member of the Chartered Financial Analyst (CFA) Institute and a CFA Charterholder, a two-term advisor to the GFOA Treasury and Investment Management (TIM) committee, a Registered Investment Advisor, and holds FINRA Series 7, 24, 63, and 65 licenses.
About Greg Warner, CTP
 As HilltopSecurities Asset Management’s Co-Head of Investment Management, Greg Warner specializes in investment management services and is responsible for the management and oversight of more than $30 billion in institutional fixed income assets for HilltopSecurities’ public sector municipal clients. Greg coordinates all client services and portfolio management duties, including security evaluation and portfolio analysis, trading, investment reporting, board presentations, and monitoring of broker-dealer relationships. He is an advisory committee member to the Texas Association of Counties, a member of the Government Treasurers’ Organization of Texas (GTOT), a Registered Investment Advisor, a Certified Treasury Professional (CTP) and holds FINRA Series 7, 63, and 65 licenses.
About Matt Harris, CFA
 As HilltopSecurities Asset Management’s Senior Portfolio Advisor, Matt Harris specializes in investment management services for public sector municipal clients. He developed his experience in the banking industry, supporting balance sheet management, interest rate risk analysis, liquidity planning, and investment strategy implementation. At HilltopSecurities, he works closely with clients to develop and implement customized investment strategies, oversees account documentation and reporting, and assists clients with the public funds depository review process, including competitive RFP evaluations. Harris is a member of the CFA Institute and a CFA Charterholder, a Registered Investment Advisor, and holds FINRA Series 7, 63, and 66 licenses.
The paper/commentary was prepared by HilltopSecurities Asset Management (HSAM). It is intended for informational purposes only and does not constitute legal or investment advice, nor is it an offer or a solicitation of an offer to buy or sell any investment or other specific product. Information provided in this paper was obtained from sources that are believed to be reliable; however, it is not guaranteed to be correct, complete, or current, and is not intended to imply or establish standards of care applicable to any attorney or advisor in any particular circumstances. The statements within constitute the views of HTS and/or HSAM as of the date of the document and may differ from the views of other divisions/departments of Hilltop Securities Inc. and its affiliates. In addition, the views are subject to change without notice. This paper represents historical information only and is not an indication of future performance. Sources available upon request.
HilltopSecurities Asset Management is an SEC-registered investment advisor. Hilltop Securities Inc. is a registered broker-dealer, registered investment adviser and municipal advisor firm that does not provide tax or legal advice. HTS and HSAM are wholly owned subsidiaries of Hilltop Holdings, Inc. (NYSE: HTH) located at 717 N. Harwood St., Suite 3400, Dallas, Texas 75201, (214) 859-1800, 833-4HILLTOP.