

click below to login to your secure account
By
Tom Kozlik
Head of Public Policy and Municipal Strategy
Hilltop Securities Inc.
The current infrastructure buildout is expanding the municipal market’s annual capacity. Large capital programs, rising project costs, technological change, and essential infrastructure needs are supporting record issuance despite higher rates and realigning credit conditions.
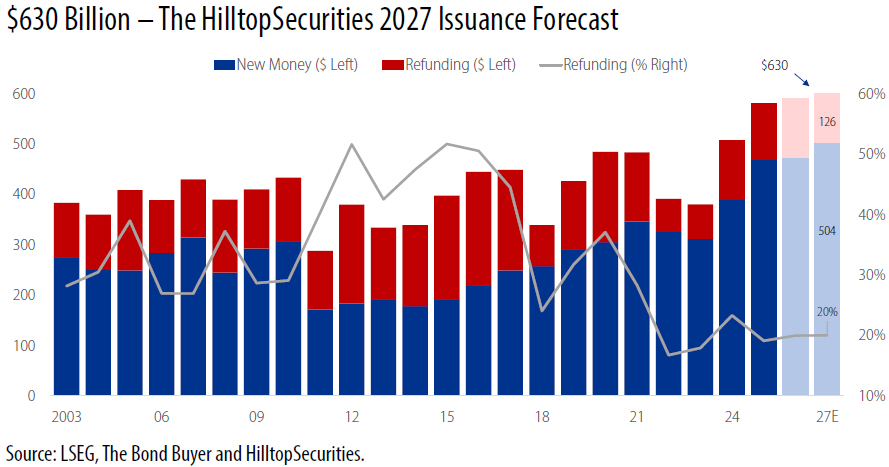
Record issuance no longer depends on a peak-credit backdrop, low interest rates, or an unusually favorable refunding environment. We forecast $630 billion of municipal bond issuance for 2027, approximately 6.7% above the expected 2026 total and another annual record.
The increase will not be evenly distributed across the entire market. Tax-backed borrowing is likely to remain near 2026 levels as governments manage inflation, demographics, rising expenses and bring recurring expenditures back into line with recurring revenues. Revenue-backed and specialty-sector issuance should continue to expand, led by electric power, energy prepay, airports, health care, housing, student loans, and other infrastructure borrowers.
Our $630 billion forecast includes approximately $504 billion of new-money issuance, or 80% of the total, and $126 billion of refundings, or 20%. Reaching that level does not require a sharp decline in interest rates or a historically attractive refinancing cycle. It depends primarily on the continuation of the infrastructure financing cycle that has been gaining momentum in recent years and really materialized in 2026. This shift has been building, intensified in 2026, and is likely to not just continue but intensify in 2027.
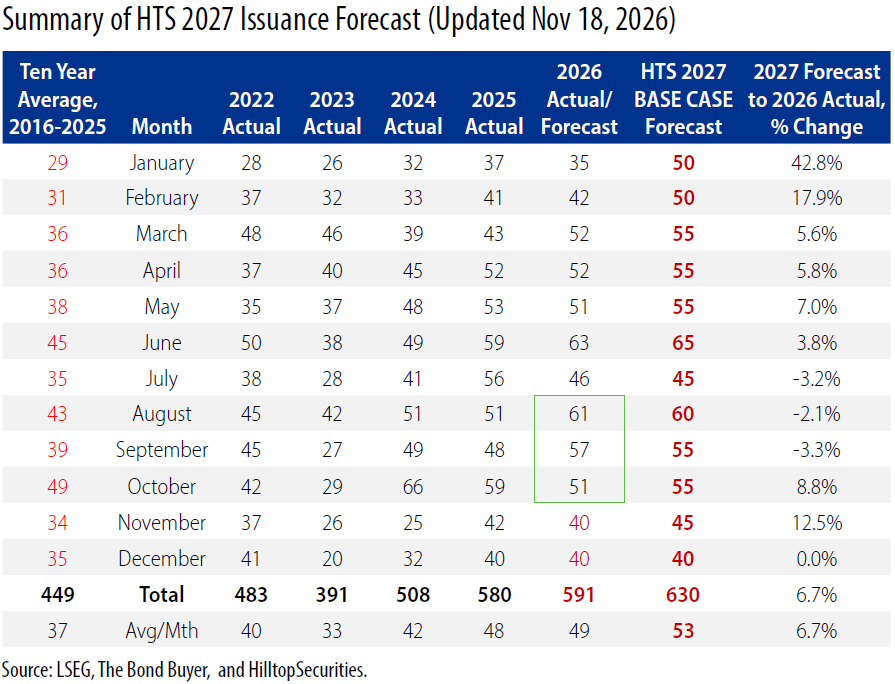
Moving from an estimated $591 billion (or potentially higher) in 2026 to $630 billion in 2027 requires approximately $39 billion of additional issuance. In a market approaching $600 billion in annual volume, that represents important growth, but not an extraordinary departure from the existing trend we have witnessed in recent years.
Higher interest rates could affect the timing and composition of 2027 issuance. Expectations are that another rate hike is expected from the U.S. Fed in December. However, higher rates are unlikely to prevent another record. But still, higher interest rates are probably the most significant risk to our forecast. They could reduce refunding opportunities, increase debt service costs, and can delay pricings.
But the experience of the end of the summer of 2026 weakened the assumption that higher rates necessarily lead to lower issuance. Municipal issuance averaged approximately $56 billion per month in August, September, and October, when interest rates were among their highest levels of the year. Borrowers continued to finance capital programs despite higher yields, volatile market conditions, and financial uncertainty.
Interest rates are only one part of the borrowing decision. Municipal capital programs are usually developed over several years. Issuers can adjust the timing, size, and structure of a transaction, but many projects cannot be deferred indefinitely.
The additional issuance in 2027, above and beyond the $600 billion level, is likely to come primarily from revenue-backed borrowers and specialty sectors with increasing and defined capital needs and identifiable revenue streams.
The American Society of Civil Engineers gave U.S. Energy infrastructure a “D+” in its 2025 Infrastructure Report Card, compared with a “C” for U.S. infrastructure overall. ASCE estimated the Energy sector’s 10-year funding gap at $578 billion. The combined gap for Drinking Water, Wastewater, and Stormwater approaches $1 trillion. Issuers are trying to make up some ground during this buildout.
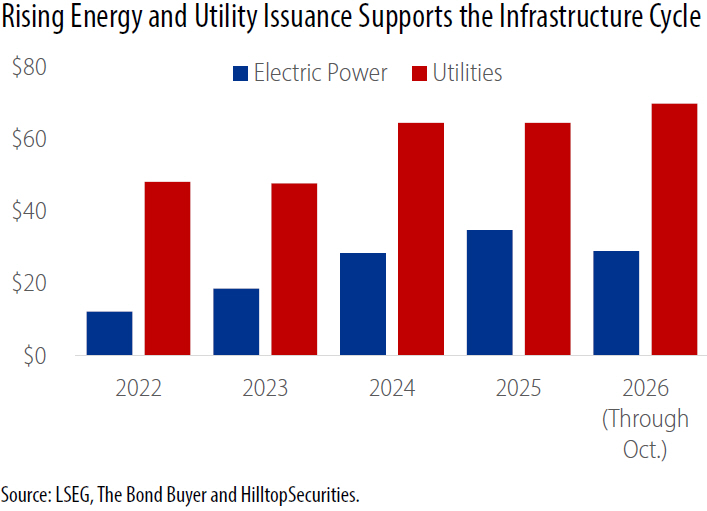
A rise in the amount of electric power and energy financings is central to our 2027 forecast. After years of flat or declining demand in the wake of the Great Recession and Financial Crisis of 2008, utilities must now address load growth, reliability, generation and transmission needs, and infrastructure supporting technology investment. These projects take years to plan and are difficult to put off.
Energy prepay transactions should remain another important source of increased supply. Volume will depend on transaction economics and market conditions, but the sector demonstrated in 2026 that it can contribute substantially to annual issuance when those conditions are favorable.
Airports are also working through multiyear capital programs involving terminals, runways, parking, concessions, and related facilities. Interest rates can alter financing schedules, but they do not eliminate the need to maintain and expand major transportation assets. We do not expect airport issuance to be especially sensitive to rising rates.
Tax-backed issuers will enter 2027 under a different set of credit and operating conditions. Broad public finance credit quality appears to have peaked in 2023 or 2024, following several years of strong revenue growth, federal support, and rising reserves. Governments began realigning recurring revenues and expenditures in 2025 as temporary federal aid faded and operating costs rose. We described this dynamic as the Post-Golden Age Realignment, when state and local governments and school districts had to restore structural balance after a surge of federal aid.
Those adjustments, or that ongoing realignment, is likely to continue in 2027, but it does not represent a broad credit downturn. State government rainy-day funds remain above historical levels. State and local government revenues are higher nationally than they were a year ago, and property-tax collections continue to benefit from elevated home values. Therefore, we have maintained our “Stable” credit sector outlooks on the “State” and “Local Government” sectors.
Most of the pressure is coming from rising expenditure demand. Labor, insurance, construction, health care, and other operating costs have risen. Slower home sales could eventually restrain assessment growth and transaction-related revenues. In some cases reduced federal aid is forcing some governments and school districts to determine whether programs supported by temporary funding can be maintained with recurring revenue.
Results from the 2026 HilltopSecurities Public Finance Leaders Survey identified workforce and budget issues as the leading challenges for public entities heading into 2027. Those issues are closely connected. Governments may need to raise compensation and spend more to maintain workforce capacity.
K-12 school districts warrant particular attention. We assigned a “Negative” credit sector outlook to the K-12 sector at the beginning of 2026, and realignment in this sector has been and will continue. Many are managing rising labor and transportation costs, enrollment changes, fixed facility expenses, and reduced federal support within funding systems they do not fully control. Rating pressure increased in 2025 and 2026 and rating pressure will likely continue in 2027, as we discussed in The Transition from Credit Momentum to Credit Selection, Public Finance Enters a More Demanding Phase.
Bond referendums are a source of ongoing activity. Voters approved nearly $96 billion across 583 state and local bond measures in 2024, followed by at least $67 billion of authorizations in preliminary 2026 results for schools, housing, and other public investments. The scale of these approvals provides a substantial pipeline of authorized borrowing that should support tax-backed supply over several years, even if budget pressure and affordability concerns prevent that part of the market from driving the overall increase.
These sector pressures are likely to restrain growth in general obligation and other tax-backed issuance, but not cause a broad retreat, according to our base case. Many governments still have strong reserves, manageable debt burdens, and substantial capital needs. We expect the 2026 pattern to continue in 2027, with tax-backed issuance remaining historically high but contributing less to the market’s incremental growth.
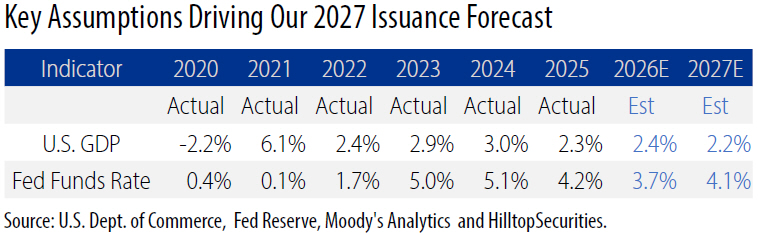
The economy is entering 2027 with more momentum than expected. Real GDP grew at a 3.4% annualized rate in the third quarter of 2026, supported by consumer spending and continued investment in technology infrastructure.
The November 2026 Moody’s Analytics base case forecasts 2.2% real GDP growth in 2027. That would represent slower but continued expansion, supporting employment, tax collections, transportation activity, utility demand, housing, and capital investment. Recent activity also suggest some upside if consumer spending and business investment remain steady.
Our issuance forecast does not require stronger growth. The greater risk is a sharper slowdown combined with persistent inflation and higher long-term rates, which could weaken revenues, raise operating costs, and make capital financing more expensive. That could move issuance toward the lower end of our expected range, but again such a scenario is not our base case.
Municipal bond issuance has set or approached a record in five of the past seven years, suggesting that elevated volume is no longer an exception. That pattern is consistent with the $3.7 trillion infrastructure funding gap identified by the American Society of Civil Engineers. Infrastructure needs, rising project costs, and expanding revenue-backed sectors continue to increase annual issuance despite elevated borrowing costs.
Our 2026 outlook anticipated normalization, slower growth, and greater fiscal discipline. Those forces emerged but did not prevent record issuance because infrastructure financing was stronger than we expected. Reaching $630 billion in 2027 requires neither lower rates nor a historic refinancing cycle. It requires the infrastructure financing cycle that developed in recent years and emerged in 2026 to continue.
 As Head of Public Policy and Municipal Strategy, Tom Kozlik advises HilltopSecurities’ businesses and clients on strategies related to U.S. public policy, public finance, and infrastructure. He publishes regular commentary that provides insight into current trends affecting these themes across a variety of sectors and geographic regions. Kozlik is frequently featured in print, digital, and broadcast news segments and regularly offers his expertise as a keynote speaker and panelist at industry conferences and events across the country. He can be reached at 214.859.9439 or tom.kozlik@hilltopsecurities.com.
The paper/commentary was prepared by HilltopSecurities (HTS). It is intended for informational purposes only and does not constitute legal or investment advice, nor is it an offer or a solicitation of an offer to buy or sell any investment or other specific product. Information provided in this paper was obtained from sources that are believed to be reliable; however, it is not guaranteed to be correct, complete, or current, and is not intended to imply or establish standards of care applicable to any attorney or advisor in any particular circumstances. The statements within constitute the views of HTS Public Finance as of the date of the document and may differ from the views of other divisions/departments of Hilltop Securities Inc. In addition, the views are subject to change without notice. This paper represents historical information only and is not an indication of future performance. This material has not been prepared in accordance with the guidelines or requirements to promote investment research, it is not a research report and is not intended as such. Sources available upon request.
Hilltop Securities Inc. is a registered broker-dealer, registered investment adviser and municipal advisor firm that does not provide tax or legal advice. HTS is a wholly owned subsidiary of Hilltop Holdings, Inc. (NYSE: HTH) located at 717 N. Harwood St., Suite 3400, Dallas, Texas 75201, (214) 859-1800, 833-4HILLTOP.